- Illumination Analysis & Optical Design Software
- TracePro – Illumination & Optical/Opto-Mechanical Design Software
Features | Applications | RayViz for SolidWorks - OSLO – Optical Design Software
Feature Highlights - VirtualLab - Ray, Wave & Electromagnetic Optic Design Software
Software | Solutions | Services - Lighting Design Software & Services

Features | Analysis & Reports | CAD Integration | Edition Comparison | Optimization | Performance & Accuracy | User Interface | Utilities
FEATURES
Illumination system designs using TracePro are often accomplished in an iterative manner with modifications between steps handled manually or through 2D and 3D optimization based on user-defined criteria:
- Layout of physical geometry, setting optical properties, specifying location, and orientation
- Definition of optical sources as grid sources, surface sources or ray files
- Tracing rays to calculate illumination distributions throughout the system
- Optimization
- Results analysis
- Reporting
Solid Modeling
TracePro models are created by importing lens design or CAD files, or by directly creating solid geometry within TracePro. You can modify imported or built geometry using move, rotate, and scale operations for solid objects and sweep and revolve operations for surfaces via the user-friendly, 3D CAD interface. Special tools allow you to insert primitive solids (tubes, blocks, cones, and spheres), and optical elements (lens elements, reflectors, and Fresnel lenses).
TracePro’s utilities allow interactive sketching to quickly enter 2D and 3D profiles and then extrude, revolve, and combine these profiles to create sophisticated geometry, like lightpipes and biconic reflectors, as well as free-form optics. Visualization options include solid rendering, silhouette, wireframe, hidden line views, and the ability to pan, rotate, and zoom, as well as other standard geometry manipulation techniques.
Optical Properties
A wide range of material and surface properties are available to apply to objects and surfaces in the model. Optical properties that you can specify include index of refraction and absorption coefficient, aperture diffraction, reflectance and transmittance coefficients, surface absorption, surface and volume scatter, polarization, fluorescence, gradient index, and temperature distribution. You can create surfaces with random or periodic arrays of repeated structures using the RepTile™ feature. You can define custom properties or choose from TracePro’s database of commercially-available materials and coatings.
Light Sources
TracePro simulates the distribution of luminous intensity, irradiance/illuminance, and flux throughout a model or at selected surfaces by tracing rays using the Monte Carlo method. Light sources are modeled by emitting rays. Additionally, TracePro’s Surface Source Property Utility enables you to digitize angular and spectral information directly from a manufacturer’s datasheet.
You can define ray sets using any combination of three methods:
- Grid – specify spatial and angular beam profile, weighting, and dimensions along with beam orientation, polarization state, and degree of polarization.
- Surface – specify angular distribution from one or more surfaces of a solid object using luminance flux, or irradiance/illuminance. Surfaces can also be defined as blackbody or gray body radiators.
- Ray File – predefined ray tables consisting of XYZ starting points and direction vectors, polarization states, wavelength data, and the initial flux value or Stokes Vector for each ray. Ray files are typically created from measured results or theoretical calculation.
Ray Tracing
The TracePro ray tracing engine is known for both performance and accuracy.
Analysis
TracePro provides a comprehensive set of tools to view and analyze results of the ray-trace including:
- Irradiance/illuminance maps show irradiance incident, absorbed, or exiting a selected surface. Options are available to control output, and you can export results to a text file or a bitmap file.
- Luminance/Radiance Maps can be displayed as true color based on the wavelengths traced. You can also create a photorealistic rendering using the optical properties and sources applied to the model.
- 3-D Irradiance/illuminance plots map the incident flux on the selected surfaces or objects, displayed on top of the 3D CAD geometry.
- Candela plots show luminous or radiant intensity in candela or watts/steradian.
- Polarization maps chart the polarization ellipse for the incident flux on to the selected surface. Color levels and ellipses graphically display the degree of polarization and ellipicity at points on the surface.
- Incident Ray Tables provide tabular output of every ray incident on a selected surface.
- Ray History Tables give you complete history of every ray incident on a selected surface.
- Path Sorting Tables give you a sortable table of ray paths incident on a selected surface, with interactive viewing of rays and irradiance maps.
Map and plot output can be further controlled with Ray Sorting. For example, analysis results can be filtered to show only the rays intersecting a surface, rays of a certain wavelength, interaction type, or flux range.

Desklamp - Irradiance
Optimization
TracePro offers sophisticated 2D (for axially or biaxially symmetric systems) and 3D (for asymmetric systems) optimization providing complete and interactive control of optimization parameters.
Reporting
TracePro can generate a variety of ray trace and property reports. For example:
- Flux Reports provide a summary of surface area, number of incident rays, incident and absorbed flux and lost flux. Data is displayed for bulk absorption and incident flux for each object.
- Property Data Reports contain the model’s property data.
- Ray Trace Reports display physical and virtual memory usage and elapsed ray trace time.
ANALYSIS & REPORTS
(Back to Top)TracePro provides a comprehensive set of tools to view and analyze results of a
ray trace simulation, including:
- Irradiance/Illuminance Maps show irradiance, CIE xy or u’v’, and true color maps of light incident on, absorbed by, or exiting a selected surface. Multiple options are available to control pixel count, profiles, relief plotting, linear and logarithmic output, gradient, color maps, and smoothing
as well as exporting results to a text file or a bitmap file for later viewing - Candela Plots are plots of luminous intensity, or flux per solid angle. In photometric units, a luminous intensity plot is in units of candelas, or lumens per steradian. In radiometric units, the corresponding quantity is called intensity, and has units of watt/steradian. Candela plots are commonly used in the design of illumination systems. Several Candela Plots may be displayed from the raytrace data. Depending on your selections in the Candela Options dialog box, TracePro considers incident rays, exiting rays, or flux that misses all the model geometry during the raytrace as Candela data. The candela plots present flux versus angle and can be smoothed using the Candela Options dialog box. The iso-candela plots can be presented as false color maps or contour plots. The distribution plots are graphs of cross-sectional curves through the candela distribution.
- Luminance/Radiance Maps can be displayed as true color based on the wavelengths traced. Luminance Maps can be used to make very accurate photorealistic renderings using the optical properties and sources applied to the model. 3D Irradiance Plots map irradiance, CIE and true color plots of the incident, absorbed or exiting flux onto the selected surfaces or objects
in the system view. This mapping is achieved by layering the light map of the displayed flux or color output on top of the 3D CAD geometry.
Multiple options are available for contour plotting, transparency, ambient lighting, linear and logarithmic output, gradient shading, color maps, and smoothing. Candela Plots show luminous or radiant intensity in candelas or watts/steradian. There are four types of candela plots, Polar Candela and Iso-Candela, Rectangular Candela and Iso-Candela. - Polarization Maps chart the polarization ellipse for the incident flux onto the selected surface. Color levels and ellipses graphically display the degree of polarization and ellipticity at points on the surface.
- Incident Ray Tables provide tabular output of rays incident on a
selected surface. - Ray History Tables create a complete history of every surface intersection along the path of the ray, for each ray incident on a selected surface.
- Path Sorting Tables create a sortable table of every non-sequential ray path incident on a selected surface, with interactive breakout and visualization
of each ray path, and irradiance maps of selected paths. - Optical Path Length (OPL) or Time-of-Flight Plots present flux absorbed
or incident on a selected surface versus OPL for specialized analyses. - Volume Flux Maps visualize the flux absorbed, incident, lost,
or emitted throughout a rectangular volume.
Map and plot output can be further controlled with Ray Sorting. For example, analysis results can be filtered to show only the rays intersecting a surface,
rays of a certain wavelength, interaction type, or flux range.
TracePro can generate a variety of ray-trace and property reports, including:
- Ray Sorting, Tracing, Histories
- Flux
- Path Sorting
- Irradiance/Illuminance
- 3D Irradiance/Illuminance
- Radiance/Luminance
- Candela
- Incident Ray Table
- OPL/Time of Flight
CAD INTEGRATION
(Back to Top)SolidWorks is the most popular CAD system in use today for luminaire mechanical design.
Rayviz adds additional functionality to SOLIDWORKS by allowing you to do a simple raytrace to verify geometry, visualize rays traced from any surface, and check ray paths. Designers can significantly accelerate the development process without sacrificing performance or functionality by utilizing the easy-to-learn interface and minimal setup time in Rayviz.
How RayViz Works:
- Use SOLIDWORKS 2013 or later to create the parts and assemblies
- Apply optical properties from the included property database
- Run a raytrace to see the rays and the ray paths
- Export the model as a TracePro®. OML file for full analysis in TracePro
Please note that RayViz is not a replacement for TracePro. RayViz complements TracePro and expands the capabilities of SOLIDWORKS by adding a database of optical properties and the ability to run raytraces directly in SOLIDWORKS. RayViz allows for the easy export of models to TracePro and the same model is used by both TracePro (for raytracing and optical analysis) and SOLIDWORKS (for mechanical design and applying optical properties) to ensure data integrity. The tools in TracePro can then be used for a full optical analysis of the model.
CAD File Translators
TracePro includes translators that enable import and export of CAD files in SAT (ACIS) format. Additional translators are available as optional add-ins that permit import and export of IGES and STEP files, and import of other popular CAD file formats.
Lens Design File Translators
TracePro includes translators to import lens design files from popular optical design programs, including OSLO, Code V, and Zemax.
EDITION COMPARISON CHART
(Back to Top)Three editions of TracePro are available to cost-effectively accommodate your design needs. Please contact an applications engineer for assistance in selecting an edition of TracePro that best meets your specific requirements.
See the comparison between TracePro Editions here.
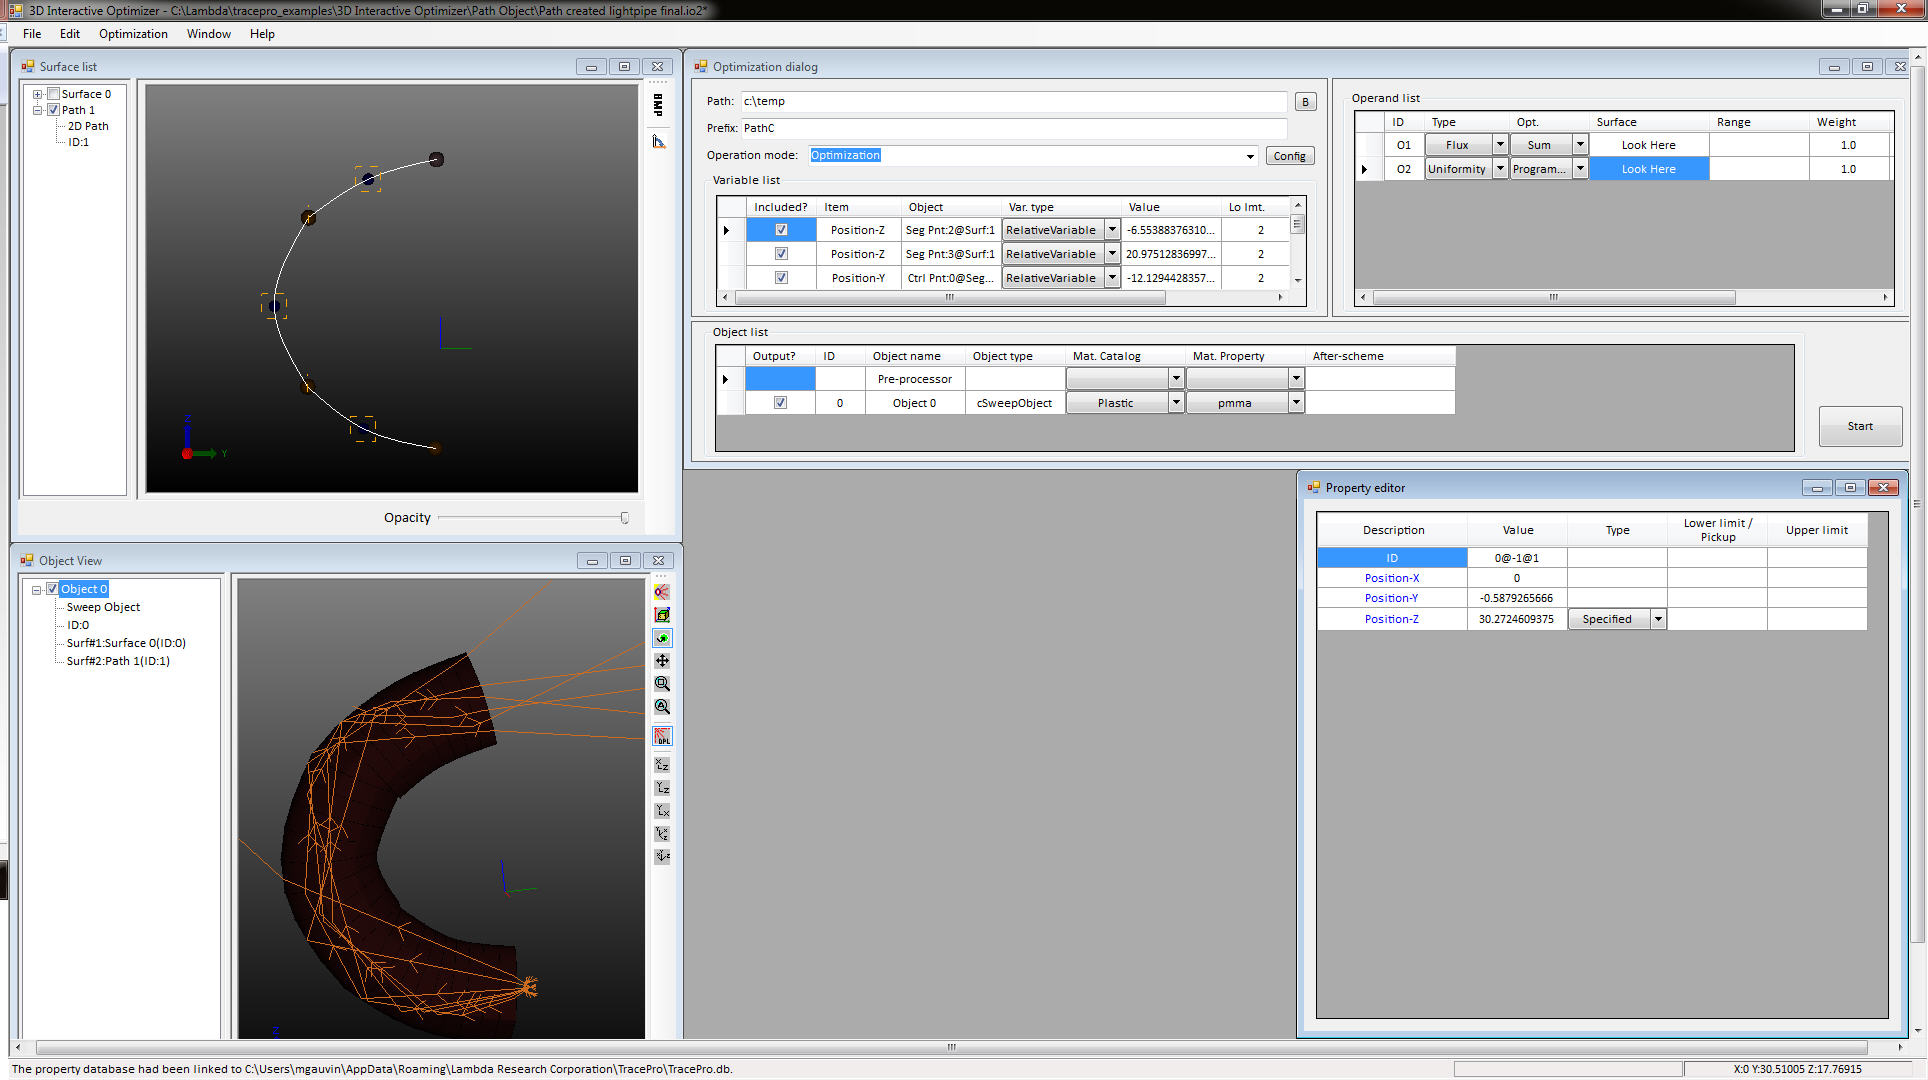
OPTIMIZATION
(Back to Top)TracePro streamlines the prototype-to-manufacturing process for optical and illumination systems using 2D symmetric and 3D non-symmetric optimization. Different from traditional optimizers, TracePro’s Optimization Utilities offer
easy-to-use and unique capabilities to interactively monitor and control
the process every step of the way.
TracePro Optimization Utilities are non-sequential optimization modules that
use dynamic data exchange (DDE) and the Scheme programming language to transfer information back and forth between the utilities and TracePro.
The utilities consist of several components to step you through the design process.
First, you can use the sketch utility to digitize an idea using line, spline,
or conic segments to create an initial design. Then, establish a merit function using five different operand types, flux, CIE (x,y), CIE (u,v), irradiance profile,
and candela profile. Each operand can be used in combination with any other operand. The merit function uses weights to balance the multiple operands based on the desired targets.
You can also employ TracePro’s powerful Scheme language to control interaction with the created geometry, modify optical properties for each
surface and solid object, and control positioning of solid objects. The object function allows you to move objects and modify control points and segments into place using the drag-and-drop interface.
Each variable can be visually checked before, during, and after optimization. Lastly, the entire design can be verified and improved using an
interactive raytracer. Validating the final design iteration ensures
the product’s performance requirements can be met quickly and efficiently.
2D/3D Optimization
TracePro’s 2D and 3D optimizers use the Downhill Simplex, also known as Nelder-Mead, method for optimization. The Downhill Simplex method is a
local optimizer that converges to the local minimum solution closest to
the starting point. During an optimization, you have complete control of
the process and can monitor the interim solutions. You can stop the optimizer
and change the initial starting parameters, then re-start the optimization.
This allows you to control the process and test for better solutions in less time.
TracePro 2D and 3D Optimizers can be used for a variety of applications, including:
- LED lens design
- Diffuser and Reflective Surface Property Selection
- Lightpipe optimization
- Streetlamp optimization
- Luminaire optimization
- Baffle design
- Surface property verification and selection
All functions of the optimizer utility work with only the TracePro Standard and Expert editions.
PERFORMANCE AND ACCURACY
(Back to Top)TracePro’s ray tracing engine is fast and accurate, while giving designers complete control over parameters to achieve simulation results quickly with no compromise in accuracy. Ray tracing features include:
- Ray Splitting
- Exact Raytracing ‒ no missed intersections or “leaky” rays
- Simulation Mode for tracing very large numbers of rays
- Multiple Exit Surfaces (Simulation Mode)
- Voxelization of Object Space for fast ray tracing
- Aperture Diffraction
- Stratified Importance Sampling
Analysis Mode ray tracing, unique to TracePro, allows you to interactively examine raytrace results for any surface in your model. It is very powerful for setting up and proving out your model, or determining the feasibility of your design. For detailed, accurate simulations of your final design requiring millions of rays, use Simulation Mode to obtain analysis results for selected surfaces.
USER INTERFACE
(Back to Top)TracePro sets itself apart from other optical and illumination design
software solutions with its uniquely friendly and intuitive graphical user interface. Mechanical engineers and others familiar with CAD software will experience the shortest learning curve with TracePro.
TracePro is a standard Windows application that uses a menu bar,
icon-based toolbars, drop-down menus, and a system tree. The working area,
called the Model View, is where users will add and manipulate models they want to simulate and optimize. Properties, utilities, and other features appear in windows, drop-down menus, dialog boxes, property sheets, etc.
In the Model View and with certain utilities, you can move objects and modify control points and segments into place using the drag-and-drop interface. Rotate, scale, and orientation can also be manipulated in the Model View
or by using commands in the menu bar.

- Rendered
- Silhouette
- Wireframe
- Hidden Line
Measurement tools
Measure distance from:
- Vertex to vertex
- Vertex to edge
- Vertex to surface
- Edge to edge
- Edge to surface
- Surface to surface
Creating geometries within TracePro is extremely simple. You can add
primitive solids, such as blocks, cylinders, cones, tori, spheres, and thin sheets.
Boolean operations enable you to intersect, subtract, and unite overlapping
primitive bodies to create more complex models. Almost any surface can be extruded or revolved any number of times to create complex lightpipes,
lenses or reflector shapes. TracePro also includes allows you to create lenses, Fresnel lenses, reflectors, tubes, and baffle vanes.
UTILITIES
(Back to Top)2D and 3D Optimizers - TracePro’s optimizer utilities allow interactive sketching to quickly enter 2D and 3D profiles and then extrude, revolve, and combine
these profiles to create sophisticated geometry, like lightpipes and
biconic reflectors, as well as free-form optics. Visualization options include
solid rendering, silhouette, wireframe, hidden line views, and the ability to pan, rotate, and zoom, as well as other standard geometry manipulation techniques. A merit function can be created, with interactively-defined geometric parameters as variables, and targets based on Irradiance/Illuminance maps, candela plots, efficiency, and/or color. The optimizers will optimize the design, while allowing
interactive control of the optimization process.
Bitmap Source Utility – reads an image (e.g. jpeg) and creates a Ray File with rays emitted by the image that can be inserted into a TracePro model.
Solar Utility – analyzes solar collector systems using dialogs to specify geographical location, period of sun travel with uniaxial tracking, and
user defined irradiance for both direct and indirect sun contribution.
Analysis output includes irradiance and candela maps, with total flux and efficiency over time on the target.
Surface Source Property Utility – enables the TracePro surface source property to be set up quickly and accurately. The utility allows you to digitize angular and spectral information directly from a manufacturer’s datasheet. While useful
for LEDs, this tool can also be used to generate a surface source property for
any type of light source.
Fluorescence Property Utility for White LED Design – optimizes
down-converting of phosphor formulations and excitation LEDs selection in
white LED design. The utility also facilitates the creation of the fluorescence
material property in the TracePro model. It allows you to digitize the excitation, absorption, and emission spectra of the material and the relative spectral power distribution of the excitation LED from the manufacturer’s datasheet. While useful for white LED design, this utility can also be used to generate a
fluorescence property for any type of energy-converting material.
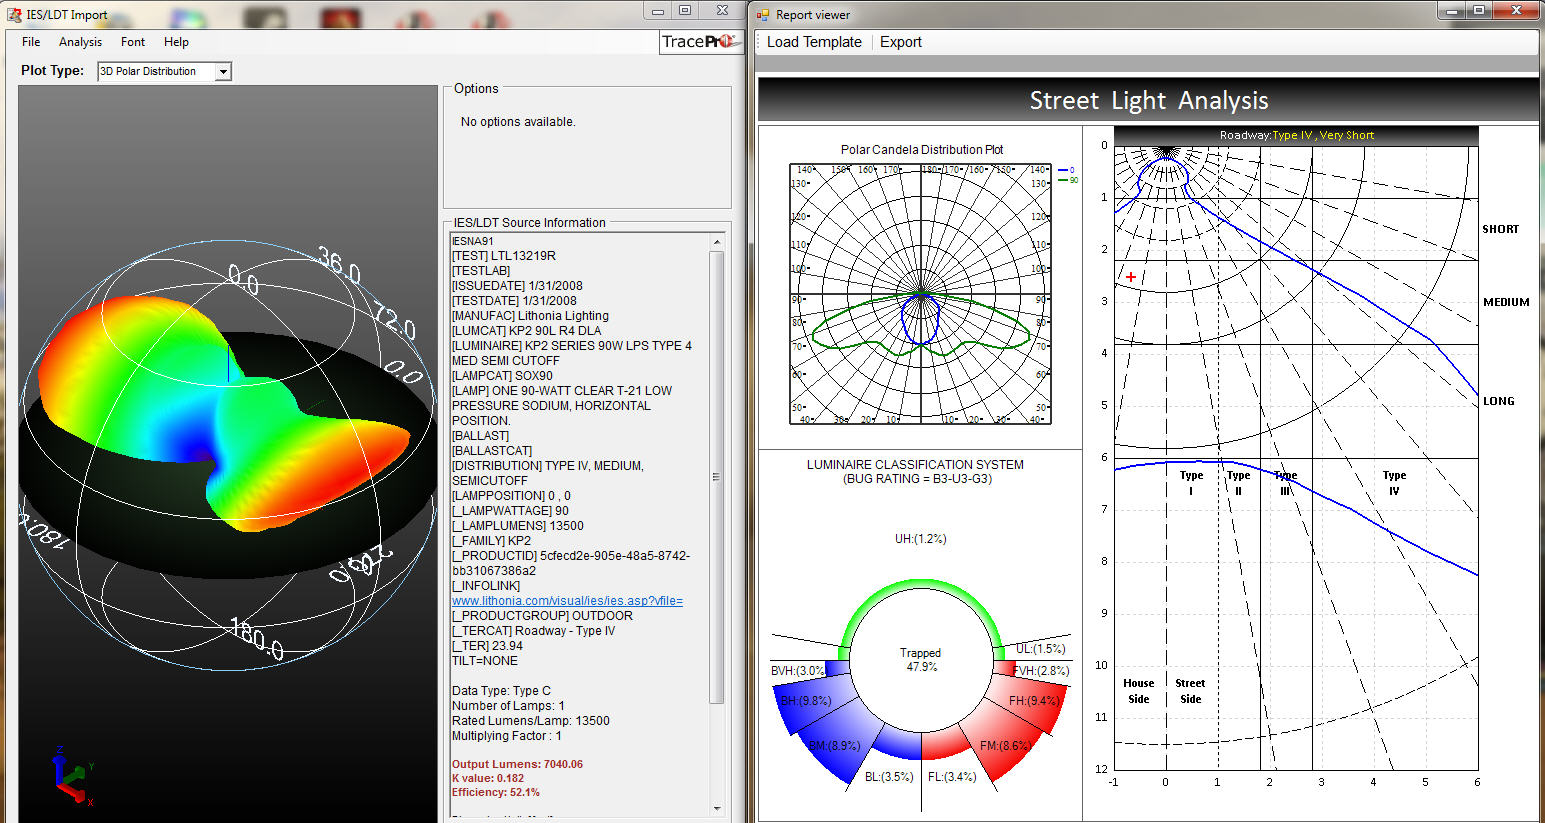
IES/LDT Analysis Utility – imports photometric data in ANSI/IESNA standard electronic file formats and directly from TracePro’s candela plot and
creates TracePro Surface Source and File Source Properties. The utility has
a large reporting capability to create customized reports and or use premade reports to output roadway, interior, and exterior data for automotive and street lighting users. The IES Import Utility adheres to the most recently published standards from the Illuminating Engineering Society of North America (IESNA).
RepTile™ Texture Optimization Utility – defines and creates repetitive microstructures on any planar surface. The utility is commonly used to
optimize structured Liquid Crystal Display (LCD) backlight components,
including Brightness Enhancement Films (BEFs), Turning Films, Edge-Lit TVs, and
extraction features in light guides. With a TracePro model of a backlight,
the RepTile utility generates and optimizes a distribution of scattering dots to
achieve a target irradiance or illuminance distribution. While useful for optimizing structured backlight components, this tool can also be used to optimize Digital Micromirror Display (DMD) chips commonly used in
DLP projection displays as well as aspheric lens arrays.
BSDF Conversion Utility – provides an easy way to transform measured
BSDF (light scattering) data into a TracePro Surface Property file. Once the measurement data is imported, the utility will automatically compute the
best-fit A, B, and g value to create a mathematical model of the BSDF for
each incident direction. The utility also allows manual adjustments of
the A, B, and g values with real-time updating of the graphical display of the BSDF. Users can also select the export type of the surface property file,
either ABg model or Asymmetric Table BSDF.


